Using the Python API#
Since gotranx is a python library you can also use it directly in python.
First we will import gotranx as well as a few other packages
import gotranx
from typing import Any
import numpy as np
import matplotlib.pyplot as plt
For this tutorial we will use a rather large system of ODE which simulated the electromechanics in cardiac cells that are based on the O’Hara-Rudy model for electrophysiology and the Land model. You can download the model in .ode format here
We load the model using the load_ode() function
ode = gotranx.load_ode("ORdmm_Land.ode")
2026-02-02 07:58:12 [info ] Load ode ORdmm_Land.ode
2026-02-02 07:58:13 [info ] Num states 48
2026-02-02 07:58:13 [info ] Num parameters 139
Now we can generate code in python using the cli subpackage and the gotran2py module`. We will also generate code for the generalized rush larsen scheme
code = gotranx.cli.gotran2py.get_code(
    ode, scheme=[gotranx.schemes.Scheme.generalized_rush_larsen]
)
Now we get back the code as a string. To actually execute this code you can either save it to a python file and import it, or you can execute it directly into some namespace (e.g a dictionary). Let’s do the latter
model: dict[str, Any] = {}
exec(code, model)
Now we can use the model dictionary to call the generated functions
y = model["init_state_values"]()
# Get initial parameter values
p = model["init_parameter_values"]()
# Set time step to 0.1 ms
dt = 0.1
# Simulate model for 1000 ms
t = np.arange(0, 1000, dt)
# Get the index of the membrane potential
V_index = model["state_index"]("v")
Ca_index = model["state_index"]("cai")
# Get the index of the active tension from the land model
Ta_index = model["monitor_index"]("Ta")
Istim_index = model["monitor_index"]("Istim")
fgr = model["generalized_rush_larsen"]
mon = model["monitor_values"]
Let us simulate the model
V = np.zeros(len(t))
Ca = np.zeros(len(t))
Ta = np.zeros(len(t))
Istim = np.zeros(len(t))
for i, ti in enumerate(t):
    y = fgr(y, ti, dt, p)
    V[i] = y[V_index]
    Ca[i] = y[Ca_index]
    monitor = mon(ti, y, p)
    Ta[i] = monitor[Ta_index]
    Istim[i] = monitor[Istim_index]
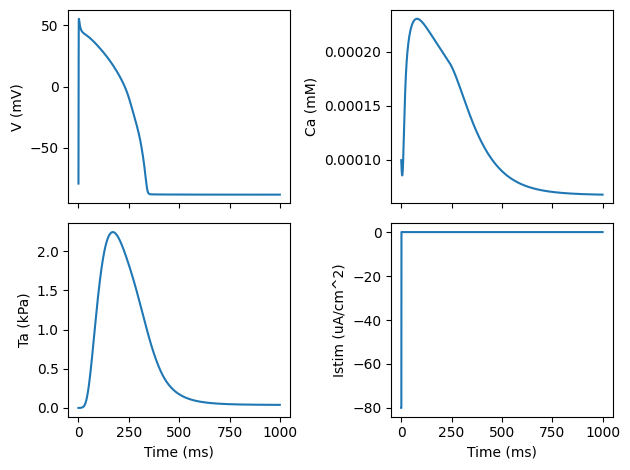
And plot the results
fig, ax = plt.subplots(2, 2, sharex=True)
ax[0, 0].plot(t, V)
ax[1, 0].plot(t, Ta)
ax[0, 1].plot(t, Ca)
ax[1, 1].plot(t, Istim)
ax[1, 0].set_xlabel("Time (ms)")
ax[1, 1].set_xlabel("Time (ms)")
ax[0, 0].set_ylabel("V (mV)")
ax[1, 0].set_ylabel("Ta (kPa)")
ax[0, 1].set_ylabel("Ca (mM)")
ax[1, 1].set_ylabel("Istim (uA/cm^2)")
fig.tight_layout()
plt.show()

