C++ tips and tricks#
While it is certainly possible to write bug-free C++ in a pure text editor without any guiding tool, most professional developers depend heavily on tools to help them write, compile and debug the code they are writing. In this section, we will go through a few tips and tricks to help develop C++ code.
C++ extension for text editors#
Most modern editors or integrated development environments (IDEs) come with the possibility of using extensions. For example, in Visual Studio Code, the C++ extension enables tab completion, documentation, and much more. Spending some time learning how to use these extensions will definitely pay off in the end. Another interesting extension is GitHub Copilot, an AI-powered tool that auto-completes code snippets in several programming languages. Given Copilot’s recent popularity, it is worth mentioning that, albeit very useful and time-saving, relying too heavily on it could hinder a beginner’s ability to learn and understand the fundamental concepts of programming.
Debugging#
The text editor or compiler will often point out mistakes before the code is run. However, at other times it is common for the code to compile even though it contains bugs. For example, if the following cryptic message is obtained when trying to run a program, one should know something is wrong.
Segmentation fault (core dumped)
It is good practice to compile and run the code often to better understand when the bug was introduced. However, sometimes it can be hard to know the cause of a program’s failure, motivating the use of a debugger.
Debugging with gdb or lldb#
The standard debugger for GNU is called gdb, while the debugger for clang is called lldb. The two interfaces are similar, and we will therefore show the commands using gdb. Nonetheless, swapping gdb with lldb when working on a Mac and using clang should work for the following examples.
Using a debugger is an alternative to putting print statements all over the code. A debugger allows code inspection in more detail, helping track down the failure’s cause.
Now we will try debugging the following nullptr_deref.cpp program
#include <iostream>

void my_function()
{
    double *a = nullptr;
    double b = *a;
    std::cout << b << std::endl;
}

int main()
{
    my_function();
    return 0;
}
This code compiles normally using the command
c++ nullptr_deref.cpp -o nullptr_deref
but when we run it, the following message returns
$ ./nullptr_deref
Segmentation fault (core dumped)
Now we will try to run the program using the debugger. Before using the debugger, we should compile our program with debugging information. This can be done by sending in the -g flag to the compiler
c++ nullptr_deref.cpp -o nullptr_deref -g
Now, we can use the debugger by executing the following command gdb <program>, where <program> is the command to run the program. In our case, this would be
gbd ./nullptr_deref
Running this will print a lot of information and open a gdb prompt.
$ gdb ./nullptr_deref
GNU gdb (GDB) Red Hat Enterprise Linux 8.2-15.el8
Copyright (C) 2018 Free Software Foundation, Inc.
License GPLv3+: GNU GPL version 3 or later <http://gnu.org/licenses/gpl.html>
This is free software: you are free to change and redistribute it.
There is NO WARRANTY, to the extent permitted by law.
Type "show copying" and "show warranty" for details.
This GDB was configured as "x86_64-redhat-linux-gnu".
Type "show configuration" for configuration details.
For bug reporting instructions, please see:
<http://www.gnu.org/software/gdb/bugs/>.
Find the GDB manual and other documentation resources online at:
    <http://www.gnu.org/software/gdb/documentation/>.

For help, type "help".
Type "apropos word" to search for commands related to "word"...
Reading symbols from ./nullptr_deref...done.
(gdb)
This prompt can be exited anytime by hitting q and enter. To run the debugger, type run and hit enter, which should then display the following
(gdb) run
Starting program: /uio/kant/ifi-ekstern-u00/henrinfi/nullptr_deref
Missing separate debuginfos, use: yum debuginfo-install glibc-2.28-151.el8.x86_64

Program received signal SIGSEGV, Segmentation fault.
0x000000000040081a in my_function () at nullptr_deref.cpp:6
6	  double b = *a;
Missing separate debuginfos, use: yum debuginfo-install libgcc-8.4.1-1.el8.x86_64 libstdc++-8.4.1-1.el8.x86_64
The important information that we get from the debugger is the following
0x000000000040081a in my_function () at nullptr_deref.cpp:6
6	  double b = *a;
It tells us that the error occurred in the function called my_function, in the file called nullptr_deref.cpp, and line 6. It also displays the relevant line.
It is also possible to print out the variable values using p <variable> where <variable>. For example, the value of a can be obtained by
(gdb) p a
$1 = (double *) 0x0
Notice that if one tried to print out the value that a points to by dereferencing it, the following error message is obtained
(gdb) p *a
Cannot access memory at address 0x0
Another useful command to know is the backtrace command bt, which shows the called functions before the error occurred.
(gdb) bt
#0  0x000000000040081a in my_function () at nullptr_deref.cpp:6
#1  0x000000000040084b in main () at nullptr_deref.cpp:12
In this case, we see that the error occurs in line 6 in nullptr_deref.cpp in the function my_function which is called from the function called main at line 12 in the file nullptr_deref.cpp.
Debugging memory leaks with valgrind#
Memory leaks can be difficult to spot, and often these bugs will go unnoticed until suddenly becoming a big problem. Fortunately, there are tools that can help track down memory leaks. The most popular one is called valgrind. Consider the following program that we call doomsday.cpp
int main()
{
    for (int i = 0; i < 10; i++)
    {
        int x = i;
        int *y = new int;
    }
    return 0;
}
In line 5, we make a heap allocation that is not freed, and thus there is a memory leak. Notice that the program compiles without errors
c++ doomsday.cpp -o doomsday -std=c++14
Now we can run it through valgrind using the following command
$ valgrind ./doomsday
and it will output the following
==2451016== Memcheck, a memory error detector
==2451016== Copyright (C) 2002-2017, and GNU GPL'd, by Julian Seward et al.
==2451016== Using Valgrind-3.16.0 and LibVEX; rerun with -h for copyright info
==2451016== Command: ./doomsday
==2451016==
==2451016==
==2451016== HEAP SUMMARY:
==2451016==     in use at exit: 40 bytes in 10 blocks
==2451016==   total heap usage: 11 allocs, 1 frees, 72,744 bytes allocated
==2451016==
==2451016== LEAK SUMMARY:
==2451016==    definitely lost: 40 bytes in 10 blocks
==2451016==    indirectly lost: 0 bytes in 0 blocks
==2451016==      possibly lost: 0 bytes in 0 blocks
==2451016==    still reachable: 0 bytes in 0 blocks
==2451016==         suppressed: 0 bytes in 0 blocks
==2451016== Rerun with --leak-check=full to see details of leaked memory
==2451016==
==2451016== For lists of detected and suppressed errors, rerun with: -s
==2451016== ERROR SUMMARY: 0 errors from 0 contexts (suppressed: 0 from 0)
It tells us that there are 40 bytes in 10 blocks that are definitely lost. In the doomsday program, each int created takes up 4 bytes, and there are 10 of them (since the loop runs 10 times). These are the same bytes that valgrind has detected. We can get even more information by first compiling the executable with debugging information using the -g flag
c++ doomsday.cpp -o doomsday -std=c++14 -g
Subsequently, if we run valgrind with the --leak-check=full flag
$ valgrind --leak-check=full ./doomsday
it will output the following
==2452829== Memcheck, a memory error detector
==2452829== Copyright (C) 2002-2017, and GNU GPL'd, by Julian Seward et al.
==2452829== Using Valgrind-3.16.0 and LibVEX; rerun with -h for copyright info
==2452829== Command: ./doomsday
==2452829==
==2452829==
==2452829== HEAP SUMMARY:
==2452829==     in use at exit: 40 bytes in 10 blocks
==2452829==   total heap usage: 11 allocs, 1 frees, 72,744 bytes allocated
==2452829==
==2452829== 40 bytes in 10 blocks are definitely lost in loss record 1 of 1
==2452829==    at 0x4C35586: operator new(unsigned long) (vg_replace_malloc.c:342)
==2452829==    by 0x40060A: main (doomsday.cpp:5)
==2452829==
==2452829== LEAK SUMMARY:
==2452829==    definitely lost: 40 bytes in 10 blocks
==2452829==    indirectly lost: 0 bytes in 0 blocks
==2452829==      possibly lost: 0 bytes in 0 blocks
==2452829==    still reachable: 0 bytes in 0 blocks
==2452829==         suppressed: 0 bytes in 0 blocks
==2452829==
==2452829== For lists of detected and suppressed errors, rerun with: -s
==2452829== ERROR SUMMARY: 1 errors from 1 contexts (suppressed: 0 from 0)
In this case, it found the memory leak in doomsday.cpp:5, present in line 5.
The memory leak can be fixed by writing the following code instead
int main()
{
    for (int i = 0; i < 10; i++)
    {
        int x = i;
        int *y = new int;
        delete y;
    }
    return 0;
}
Running it through valgrind now gives the following output
==2453475== Memcheck, a memory error detector
==2453475== Copyright (C) 2002-2017, and GNU GPL'd, by Julian Seward et al.
==2453475== Using Valgrind-3.16.0 and LibVEX; rerun with -h for copyright info
==2453475== Command: ./doomsday
==2453475==
==2453475==
==2453475== HEAP SUMMARY:
==2453475==     in use at exit: 0 bytes in 0 blocks
==2453475==   total heap usage: 11 allocs, 11 frees, 72,744 bytes allocated
==2453475==
==2453475== All heap blocks were freed -- no leaks are possible
==2453475==
==2453475== For lists of detected and suppressed errors, rerun with: -s
==2453475== ERROR SUMMARY: 0 errors from 0 contexts (suppressed: 0 from 0)
Header files and compiling multiple files#
So far, we have worked only with a single file, but very often, it makes more sense to structure the code into separate files. For example, one might want to separate the code containing the tests from the code containing the actual implementation.
Let us illustrate this with an example.
Consider the case in which we have implemented a sorting algorithm in a file called sort.cpp, and wanted to write the tests in a file called test_sort.cpp.
Here is an example
// sort.cpp
#include <vector>

std::vector<int> bubble_sort(std::vector<int> numbers)
{
    int temp;
    bool changed = true;

    while (changed)
    {
        changed = false;
        for (int i = 0; i < numbers.size() - 1; i++)
        {
            if (numbers[i] > numbers[i + 1])
            {
                temp = numbers[i];
                numbers[i] = numbers[i + 1];
                numbers[i + 1] = temp;
                changed = true;
            }
        }
    }
    return numbers;
}
In this example, the following is the testing file
// test_sort.cpp
#include <iostream>
#include <vector>

int main()
{
    std::vector<int> original{2, 4, 3, 0, 5, 1};
    std::vector<int> sorted = bubble_sort(original);
    std::cout << "Original" << std::endl;
    for (int e : original)
    {
        std::cout << e << std::endl;
    }

    std::cout << "Sorted" << std::endl;
    for (int e : sorted)
    {
        std::cout << e << std::endl;
    }

    return 0;
}
At the moment, this code will not work. The file test_sort.cpp does not know about the function called bubble_sort, so we need to somehow import this into the file.
Declarations and definitions#
In C++, there is a distinction between declaration and definition. A function declaration specifies the function’s signature, i.e., its name, the types of its arguments, and the return value. The signature of the bubble_sort function, for example, is
std::vector<int> bubble_sort(std::vector<int>);
The return type is std::vector<int>, the name is bubble_sort, and the type of the argument is std::vector<int>. Note that we excluded the name of the argument to the function (numbers) because it is not necessary for the signature. This distinction becomes important when working with multiple files.
The definition, on the other hand, refers to the actual implementation. In order to use a function, it has to be declared first. We can illustrate this with a single file as well. The following code will not compile
#include <iostream>

int main()
{
    print_hello();
}

void print_hello()
{
    std::cout << "Hello!\n";
}
It will instead give the following error
error: use of undeclared identifier 'print_hello'
    print_hello();
    ^
1 error generated.
This error says that the function print_hello is undeclared. We can fix the code by first declaring the function as follows
#include <iostream>

void print_hello();

int main()
{
    print_hello();
}

void print_hello()
{
    std::cout << "Hello!\n";
}
Header files#
When working with multiple files, we put all the needed declarations in something called header files. These files typically end with .h or .hpp.
In our case, we will create a header file called sort.hpp with the declaration of bubble_sort.
// sort.hpp
#include <vector>

std::vector<int> bubble_sort(std::vector<int>);
Note that we did not add using namespace std in the header file. It is considered bad practice to add using namespace statements in header files because this will be adopted by all files that include the header files.
We can now include the header file in both sort.cpp and test_sort.cpp by adding the following line to both files
#include "sort.hpp"
Notice the distinction between including a library from the standard library such as iostream, and this file. For the standard library (and any order installed library) one can use the angle brackets as in <iostream>. For files in the working directory like sort.hpp it is necessary to use quotation marks (") and give the relative path to that file. For example, if sort.hpp was located in a folder called include, then the import should be written
#include "include/sort.hpp"
Compilation and linking#
It might be tempting to try to compile sort.cpp using the command
c++ sort.cpp --std=c++14 -o sort
This will, however, give an error saying a main function is missing.
When compiling multiple files, we can still only have one main function, which in this case is in the file called test_sort.cpp.
Before changing topics, we need to talk about the two steps needed to go from a source file (the file ending with a .cpp) to an executable file (typically a .out file or a .exe file). These two steps are called compilation and linking. Each source file is first compiled into object files, and then the object files are linked together to form the executable.
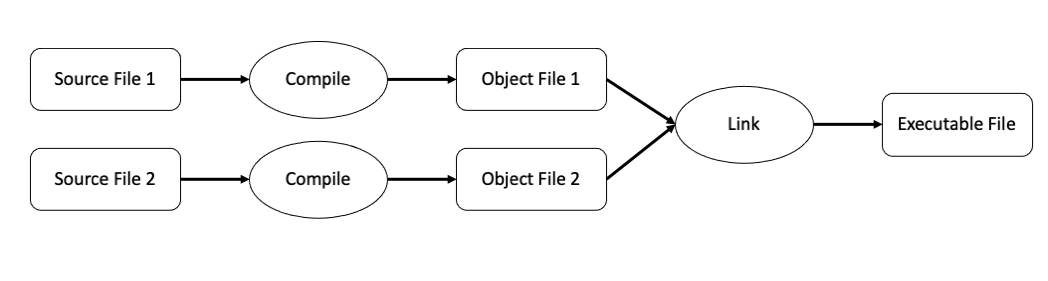
Fig. 28 Several source files are compiled individually into object files. These object files are then linked together to form the final executable file.#
The command
c++ sort.cpp --std=c++14 -o sort
can actually be split into two steps; the compilation step, where we add the -c flag and produces an object file called sort.o (or sort.obj on windows)
c++ sort.cpp --std=c++14 -c
and the linking step, where we create the executable
c++ sort.o --std=c++14 -o sort
In our case, the compilation step finishes without any errors, but the linking step will throw an error as it cannot find the main function. Indeed, the main function is in test_sort.cpp, so we need to instead compile the test_sort.cpp file
c++ test_sort.cpp --std=c++14 -c
and then link the two files together
c++ sort.o test_sort.o --std=c++14 -o sort
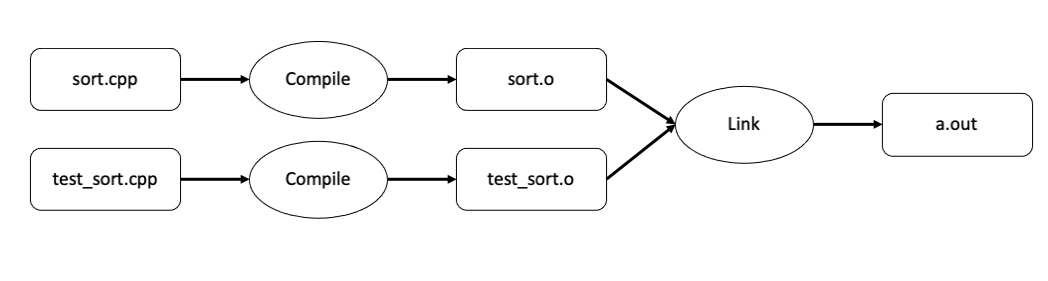
Fig. 29 Files involved to compile and link our sorting example.#
Now that we have included sort.hpp in test_sort.cpp the compiler sees that the function bubble_sort is declared. However, during the compilation step, the compiler does not need to know the definition (or implementation) of bubble_sort. It is sufficient that it knows the signature. The definition is needed during the linking step, and since sort.cpp also includes sort.hpp, the linker will figure out the definition of bubble_sort is found in sort.cpp.
Makefile - managing the compilation and linking#
The compilation and linking process can be quite tedious when many files are involved, and typing out all the commands is both time-consuming and error-prone. Tools like GNU make can help automate this process. GNU make is typically already installed in macOSX or Linux. For Windows users, the following Stack Overflow thread can be useful.
The idea is to create a Makefile (with no extension), inside of which one can define rules with the following structure
target:   dependencies ...
          commands
          ...
Each rule can then be run by using the command
make <target>
where <target> is the name of the target.
For example, when compiling sort.cpp into an object file (sort.o), the target is sort.o, the dependency is sort.cpp and the command is c++ -std=c++14 -c sort.cpp. Consequently, we can make the following rule
sort.o: sort.cpp
	c++ -std=c++14 -c sort.cpp
By adding this to a Makefile and saving it, one can compile sort.cpp into an object file by typing
make sort.o
Notice also that if the dependencies do not change (in this case, sort.cpp), make will not run the command. Instead, the following message is given
$ make sort.o
make: `sort.o' is up to date.
Let us look at a slightly more complicated example. Consider the following Makefile
sort: sort.o test_sort.o
	c++ -std=c++14 sort.o test_sort.o -o sort

sort.o: sort.cpp
	c++ -std=c++14 -c sort.cpp

test_sort.o: test_sort.cpp
	c++ -std=c++14 -c test_sort.cpp

clean:
	rm -f sort *.o
Here we have one rule for compiling sort.cpp into sort.o and one rule for compiling test_sort.cpp into test_sort.o. We also added a command with the target clean, which has no dependencies. Running make clean will delete all the object files as well as the executable file called sort.
Deleting with wildcard *
The syntax *.o simply means all files that ends with .o. The asterisk (*), commonly referred to as the wildcard character, is a placeholder for any text. When executing the command rm -f *.o it will therefore delete all files that ends with .o. The reason we also provide the -f flag here is because the command rm -f *.o will raise an error if no files matching the pattern .o exists, while if we use the -f flag, no error will be shown.
The most complicated rule here is the rule on the top with target sort. It has two dependencies, sort.o and test_sort.o. When executing make sort it will first run the command for sort.o then run the command for test_sort.o and finally run the command for sort
$ make sort
c++ -std=c++14 -c sort.cpp
c++ -std=c++14 -c test_sort.cpp
c++ -std=c++14 sort.o test_sort.o -o sort
Running make without a target
If make is run without a target, it will execute the first rule it finds. Since we placed sort at the very top, this is the rule that will be run.
CMake - a modern version of Makefile#
Even though Makefile definitely makes the process of compiling and linking easier, modern C++ projects often contain many files and many dependencies that can be difficult to compile. This leads us to a modern version of make called CMake.
CMake allows one to define how to compile a program at a higher abstraction level, therefore working very well with different compilers and operating systems. CMake can be installed from cmake.org or using conda.
Instead of a file called Makefile we now write a file called CMakeLists.txt. Let us add the following content to it
project(sorting_project
    LANGUAGES CXX
)

set(CMAKE_CXX_STANDARD 14)

add_executable(sort
    sort.cpp
    test_sort.cpp
)
The first lines provide a name for the project and which programming languages are used. Next, the -std=c++14 flag is set at a higher abstraction level. If one uses a compiler that sets the C++ standard differently than by the flag -std=c++14, CMake will take care of the possible conflicts. The final lines specify the name of the executable and list the relevant source files.
To build the program using CMake, it is good practice to first create a folder called build and go to its directory
mkdir build
cd build
Now we run the cmake command and provide the relative path to the location of the file CMakeLists.txt. Since this is now one level up, the relative path is ..
$ cmake ..
-- The CXX compiler identification is AppleClang 12.0.0.12000032
-- Detecting CXX compiler ABI info
-- Detecting CXX compiler ABI info - done
-- Check for working CXX compiler: /Applications/Xcode.app/Contents/Developer/Toolchains/XcodeDefault.xctoolchain/usr/bin/c++ - skipped
-- Detecting CXX compile features
-- Detecting CXX compile features - done
-- Configuring done
-- Generating done
-- Build files have been written to: /Users/henriknf/local/src/IN1910_H21/book/docs/lectures/cpp/build
We now see that CMake finds the C++ compiler and generates some files for us. This can be made explicit by looking into the build directory
$ ls
CMakeCache.txt      CMakeFiles          Makefile            cmake_install.cmake
We also see that CMake created a Makefile, which we will use to build the project. Executing make will create the executable
$ make
[ 33%] Building CXX object CMakeFiles/sort.dir/sort.cpp.o
[ 66%] Building CXX object CMakeFiles/sort.dir/test_sort.cpp.o
[100%] Linking CXX executable sort
[100%] Built target sort
And we now see the executable appearing in the same directory
$ ls
CMakeCache.txt      CMakeFiles          Makefile            cmake_install.cmake sort
CMake GUI for larger project
For large projects one might want to specify additional settings when configuring cmake (for example specifying where to install the project). This can be done by using ccmake (with an extra c) which will open an interactive widow where additional settings can be specified.
Formatting code with clang-format#
Just like Python has the formatting tool black, C++ has a tool called clang-format. clang-format comes installed with clang as well as with gcc.
To run clang-format one needs to point at the file to be formatted and add the -i to apply the changes to the file. For example
clang-format -i sort.cpp
or
clang-format -i *.cpp
to format all source files.
It is also possible to specify which style should be used by passing the flag --style. For example, if the llvm style should be used, one can write
clang-format -i --style=llvm *.cpp
Whichever formatting style is used, it is paramount to be consistent, and using a formatter is a great way to achieve consistency.
Run a formatter when saving
It is desirable to always have nice looking code and with a consistent code style. It is therefore a good tip to simply let the editor format the code when saving. In Visual Studio Code this can be done by setting the formatOnSave option to true.
Documentation with Doxygen#
Writing documentation#
In Python, we write docstrings in order to document our code. In C++, it is common to write multiline comments right above the function definition.
For example, in the bubble_sort function, we could write something like
/**
 * Sort a vector using the bubble sort algorithm
 * Return a new vector with arguments sorted
 *
 * @param numbers The vector to be sorted
 * @return A sorted vector
 **/
std::vector<int> bubble_sort(std::vector<int> numbers)
{
    int temp;
    bool changed = true;

    while (changed)
    {
        changed = false;
        for (int i = 0; i < numbers.size() - 1; i++)
        {
            if (numbers[i] > numbers[i + 1])
            {
                temp = numbers[i];
                numbers[i] = numbers[i + 1];
                numbers[i + 1] = temp;
                changed = true;
            }
        }
    }
    return numbers;
}
Note that we start with /**, end with **/, and at each line in between, we add an asterisk *. In the first lines, we describe the function, e.g., Sort a vector using the bubble sort algorithm. Return a new vector with arguments sorted. Then we specify the input parameters by first using @param followed by the parameter’s name (in this case, numbers) followed by that input parameter’s description. When dealing with more input parameters, these are written in separate lines. Finally, we specify what the function returns using the @return syntax.
Generating documentation with Doxygen#
Doxygen is a tool to generate documentation that can be distributed to users of the software, either through the web (via HTML) or in PDF format. It is similar to Sphinx but applies to more programming languages (Sphinx is used for Python documentation only).
Once installed, the following command can be run in the same location as the source files
$ doxygen -g

Configuration file 'Doxyfile' created.

Now edit the configuration file and enter

  doxygen

to generate the documentation for your project
This will create a file called Doxyfile that can be used to configure the documentation. There are a lot of options here, and in this example, we will change the following default settings
PROJECT_NAME = "Sorting project"
EXTRACT_ALL = YES
HAVE_DOT = YES
OUTPUT_DIRECTORY = docs
The PROJECT_NAME specifies the name of the project, which in this case, we will name “Sorting project”. The EXTRACT_ALL configuration will create documentation for all files even though it cannot find any documentation. This is useful if only some parts of the project’s code are documented. We also set HAVE_DOT to YES. When setting this to YES, Doxygen will create a dependency graph that shows how the files are related. However, it also requires another package called Graphviz. Finally, we set the OUTPUT_DIRECTORY to docs which means that the files generated from Doxygen will be put in a new folder called docs.
Now we can run doxygen by executing the command
doxygen Doxyfile
This generates two folders inside the docs folder
docs
├── html
└── latex
The generated documentation can be verified by opening docs/html/index.html.
Testing#
We have previously focused a lot on unit testing and test-driven development in Python. Testing in C++ is still very important, but for the sake of time, it will not be covered in much detail. Furthermore, C++ is a statically typed language, meaning that the compiler will check if the used functions are called with the correct type. This is in itself a very good test.
For the sake of completeness, we show a simple test in C++ using assert statements, similar to what is done in Python. In this example, we implement a method called add and write two tests for it
#include <cassert>
#include <cmath>
#include <iostream>

const double tol = 1e-12;

double add(double x, double y)
{
    return x + y;
}

int add(int x, int y)
{
    return x + y;
}

void test_add_double()
{
    auto expected = 0.3;
    auto result = add(0.1, 0.2);
    assert(abs(expected - result) < tol);
}

void test_add_int()
{
    auto expected = 3;
    auto result = add(1, 2);
    assert(expected == result);
}

int main()
{
    test_add_double();
    test_add_int();
    return 0;
}
To use the assert function, we need to include the header file called cassert. Here we also include the cmath header in order to use the abs function.